The paper looks at the spatial pattern of mortality from hazards using an improved dataset orginally based upon the Spatial Hazard Event and Loss Database (SHELDUS), which is available at http://sheldus.org), covering the period 1970-2004. Much of the paper relates to the reliability of the data and the quality of the database, but there are also some interesting outcomes in terms of the spatial distribution and also the cause of death.
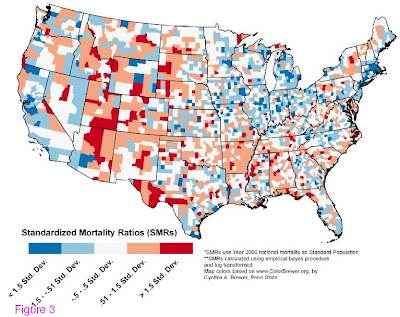
First, the spatial distribution is perhaps not what one would expect (Fig. 1). Intuitively one might say that the highest level of mortailty would be on the west coast given the earthquake hazard, but in fact the map shows no clear spatial pattern, with pockets of high mortality occurring across the whole of the country. There is a slighlty higher level of mortality in the midwest than in the east, reflecting the pattern if temperature extremes perhaps.
 Figure 1: The map of the spatial distribution of mortality across the USA for the period 1970-2004. This map is Fig. 3 from Borden and Cutter (2009) (Biomed Central Ltd).
 The reason for this is that there is a vast range of causes of death in natural hazards in the USA, with temperature-related deaths (either from heat or cold) dominating.
So what of landslides? Well, the combined datasets indicate 170 landslide fatalities out of a total of 19,958, which is 0.85% of the total. In comparison, geophysical hazards (presumably earthquakes and volcanoes) provide 302 deaths (1.5% of the total).
One of the things that the study highlights, although does not really discuss explicitly, the key importance of time in such a study, bearing in mind the low frequency but high magnitude nature of natural hazards. For instance, the time period does not include the occurrence of Hurricane Mitch in 2005 - I suspect that the map might look a little different if the >1800 fatalities in this event were included. Similarly, the map does not include a very large earthquake in California or on the Cascadia subduction zone. Therefore, great care must be taken in the use of such data to evaluate risk rather than impact.
The paper finishes by acknowledging that much work is needed on this type of analysis. The paper presented here is a very useful step along the way.
Reference
Borden, K.A. and Cutter, S.L. 2008 in press. Spatial Patterns of Natural Hazards Mortality in the United States. International Journal of Health Geographics, 7:64. doi:10.1186/1476-072X-7-64 .
There was some nice coverage of this work in yesterday's LA Times as well: see http://www.latimes.com/la-sci-hazardous17-2008dec17,0,1896896.story
ReplyDelete