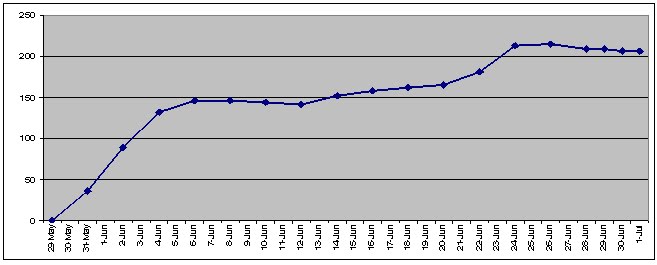
There appears to be a datapoint every two days until the last four days (which have daily data). This data suggests that the water level peaked on 24th-26th June, and has subsequently fallen somewhat, which is really good news. This coincides with the cessation of reports about houses being flooded.
This of course allows one to check the data that I have been publishing against the NDMA data. Below is the graph of my data up to the point that the feed ceased for me (the points are daily rather than two daily), with the lake level above the overtopping point in inches on the y-axis

There are some minor differences, as one would expect of two different datasets of the same natural phenomenon (the major difference is that my data are slightly higher for the middle part of the dataset), but the similarity between the two graphs is striking, which is reassuring at every level. The peak water levels recorded are almost identical (within +/-2% of each other).
I am still struggling to reconstruct the more recent changes in water level, so I have used a tool that extracts data from graphs to determine (probably +/-2%) the most recent lake level data from the NDMA plots. I have then added this to my data below to generate a compound graph. The open symbols are the NDMA data:


All-in-all the situation on the ground is evolving, which means that we are still moving towards some sort of resolution. Of course we expect to see inflow continuing to increase over the next few weeks.
The human widening of the spillway should be clearly labeled on the graphs.
ReplyDeleteI agree with Georges
ReplyDeleteThe videos taken Friday the 2nd ( http://www.youtube.com/watch?v=j0SvVIMxygg and http://www.youtube.com/watch?v=b-zPSWJ3iTo , which were pointed out in a comment in Dave's other blog) appear to show the isolated boulder still being a major impediment. (Its still right in the middle, and water just piles up on it before sliding off to the left and right).
ReplyDeleteBut compared to the Pamir times images from a week ago (and the other video taken about the same time) there is significant deepening of the pathway that goes around this boulder on the right (far) side. Now this bypass channel is mostly smooth flowing blue water until it gets beyond the boulder, whereas a week ago it was turbulent white water starting several meters upstream. (compare to image 3400 at http://pamirtimes.net/2010/06/28/deadline-given-by-protesters-for-excavation-of-the-spillway-ends-today/)
I agree that the right bypass channel around the top midstream boulder seems to have deepened, but still emphasise that this boulder does NOT govern flow or level. The water piling up on the upstream demonstrates a fountain effect where the obstruction resolves kinetic energy back to potential energy without much loss to turbulence effects. The water has already descended considerably as the speed at the boulder shows.
ReplyDeleteThe principal obstruction still appears to me to be at the top of the V just above where the white eddies end.
I would consider drilling from the bank and blasting at that point, but that would not much affect the slab I suspect at the bottom there, but blasting at the bank might effect a bypass of the slab.
The video reinforces my suspicion that the situation is being left to nature.
George
Well, as a first approximation, the resistance (R) to flow (F) can be estimated by the pressure differential (i.e., the difference in water height), since we know that F is constant all along the channel. R= delta P / F
ReplyDeleteAlthough the exact magnitute is hard to discern from the videos, they (and the photos from last week) show pretty clearly that the water level drops substantially (a couple of meters?) after this boulder, but not really very much in the stretch leading up to it.
Looked at another way, the water that backs up in front of this boulder is preventing the water a meter behind it from moving forward as fast as it could (which retards the water a meter behind it, ... and so on). IOW, remove that boulder and the water level at it's current front face would drop a meter or so, and thus the pressure differential driving the water up to that point will increase.
So, IMO, right now that boulder is the choke point. Once it's out of the picture, the choke point will be move up stream and the rocks creating the V pattern will probably become the significant barrier.
BTW, I wonder if they can get someone with a drill onto that rock via a cable (or 3!) stretched across the spillway? (not that I'm volunteering to do it :) It's certainly a smaller object than that massive rock formation they demolished out at the point.
Ultimately this isn't about this one boulder or that one boulder, but rather the fact that the lake's water level continued to increase after the initial spillway flow. Had the lake level held constant, or gone down, then this discussion would not be about this restriction or that restriction.
ReplyDeleteThe inflow continued to increase, and the inflow was greater than the outflow, so the lake level continued to increase. This brought a high level of frustration to the locals, especially those with property at points where small changes in lake elevation covered large areas of land.
If this were an uninhabited area, without a major highway, there would be far less discussion.
As far as "energy dissipators," what happened to the conservation of energy? (lol)
Note, however, that to slow the water down those "energy dissipators" increase the depth of the water.