A number of commenters here have suggested that the structure of the dam is such that it cannot now fail due to the presence of the large boulders. So I thought I'd write a short post exploring whether this is actually the case. I believe that it can still fail, and indeed that eventually it probably will, but I have no idea as to the likely time-frame. The reasons that I believe that a failure is still highly possible are as follows:
1. This is a landscape littered with large landslide scarsIn the Attabad area alone Shroder (1998) identified six previous very large landslides:
"Multiple overlapping rockslides have repeatedly thundered into the Hunza River near Atabad, several with serious and destructive consequences. The six slope failures of interest here are: (1) older Serat rockslide; (2) younger Seratrockslide; (3) Ghammessar slope failure and lake; (4) Ghammessar breakout flood and retrogressive slump failure; (5) 1962 Ghammessar rockslide and lake; and (6) 1991 Sulmanabad rockfall."
Both upstream and downstream this pattern is repeated - there are literally hundreds of large rockslide scars in this landscape, many of which will have blocked the valley in a similar way to Attabad.
So how many landslide dams are left? There are fragments and remains of them in many locations, but there are very few intact landslide dams. This suggests that most such valley blockages eventually fail, although not necessarily rapidly. There are no real grounds at this stage to assume that the dam at Attabad is exceptional.
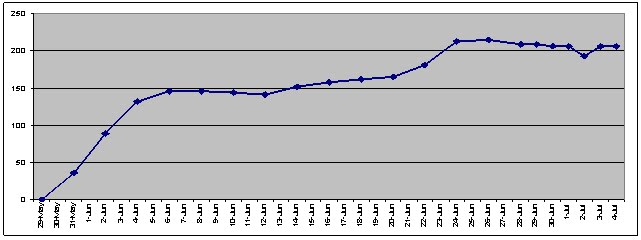
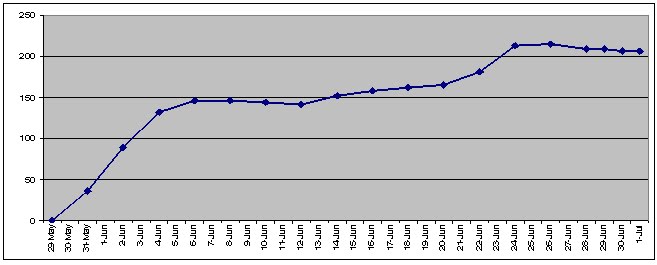
2. We are still some way from peak flowThe
data from David Archer that I presented in an earlier post suggests that we are probably three weeks or so from the peak flow, which may well be 30-50% greater than at present. Whilst there are grounds for optimism that the structure may survive such flows, it is far from certain that this will be the case.
3. Landslides into the lake are a real threatLandslides continue to occur on the walls of the valley. A large slide still has the potential to create a wave that could trigger a rapid collapse. This threat has not diminished. We believe that this was the failure mode for the 1858 landslide dam just downstream at Salmanabad. There is a need for proper assessment of this threat before one could sound the all-clear. I hope that NDMA are on the case.
4. The dam is still losing volumeImages of the downstream area of the river show that the water is still carrying a substantial amount of sediment, as this
Pamir Times image from a week or so ago shows:
The loss of volume implies that the dam is weakening with time, but it is not clear how fast or where. Nonetheless, until this ceases the potential for failure remains.
5. This is a river with GLOFsGLOFs are glacial lake outburst floods, which are flash floods created by the collapse of lakes dammed by glaciers or moraines high in the mountains. GLOFs create short duration, very large magnitude floods. The Hunza suffers GLOFs on a regular basis. Such an event would lead to a greatly increased flow rate over the spillway, threatening its stability.
6. EarthquakesThis is an area of high seismic hazard. A substantial earthquake would threaten the dam in a number of ways. First, the dam itself could undergo slope failure and collapse. Second, the earthquake could create a seiche (standing waves) in the lake that could overtop the dam, inducing failure. Third, an earthquake could trigger further slope failures into the lake, causing waves. The likelihood of an earthquake is low, but the consequences could be very serious.
Please do not believe that the boulders rule out the possibility of the release of the lake. This is not the case, despite their size. If the flow velocity and volume is sufficiently high then this dam can still fail. Unfortunately it is impossible to say when and how this might occur, or how rapidly such an event might develop. The chances of a very rapid failure are comparatively low, but are not negligible by any means
Meanwhile,
NDMA reported that the lake level rose 2 inches (5 cm) yesterday, although it does appear to have fallen the day before (the link on the NDMA website to the report yesterday is dead).
Local people are reportedly protesting about government action and the limited amount of compensation by camping close to the dam.
Unfortunately though the flow of information from the site remains very limited.
ReferenceShroder J.F. 1998. Slope failure and denudation in the western Himalaya,
Geomorphology,
26 (1-3), 81-105. DOI: 10.1016/S0169-555X(98)00052-X.