I thought it might be interesting to compare the occurrence of fatal landslides in July 2007 in relation to the distribution of rainfall in that month. Let's start off by looking at the July 2007 fatal landslide map (you will probably need to click on the map to get a decent view of it).

As a comparison, below are the statistics for July 2007 and July 2008, followed by the fatal landslides map for July 2008.
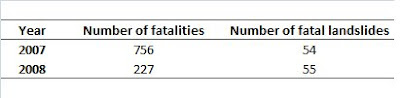

The number of fatal landslides is about the same, but the number of fatalities is very different. At first glance these two maps are also quite similar, but if you look carefully there are some key differences:
1. They are similar in that both have a clear cluster in Central China, although the location is subtly different;
2. In 2008 there were a number of landslides in Central America, whereas in 2007 there were none;
3. They both have a clear cluster along the Himalayas, but close examination shows that there are key differences between the two. In 2007 there were far more fatal landslides in Asia in 2007 than there were in July 2008. The southern edge of the Himalayas is particularly interesting - in 2007 there was a big cluster of landslides in northern Pakistan. This is not the case in 2008. In Nepal the 2007 distribution was concentrated in the west, whereas the 2008 focus was in the central part of the country. On the other hand, in 2007 there was a number of landslides in Bangladesh, but this was not the case in 2008, when only one occurred. Finally, in July 2007 there was a cluster of landslides in southern India, but only one landslide in this month is 2008.
So what drives the differences between these two years? The most obvious explanation is that of rainfall patterns between the two years. It is possible to look at this issue because
TRMM provides monthly maps of rainfall anomaly - i.e. the difference between the recorded monthly rainfall and the monthly total averaged over several preceding years. Unfortunately, this map is not available for 2008 yet, but 2007 is online. Given that most of the landslides in July 2007 occurred in Asia, let's take a look there. First the landslide map:

Now the
TRMM rainfall anomaly data. The units are mm / day difference from the long term July mean.

It should be fairly clear that there is a strong correlation between the distribution of fatal landslides and the rainfall anomaly in July 2007. In particular, the clusters along the southern edge of the Himalayan arc are focused almost exactly where the rainfall was unusually high. The apparent gap in central Nepal corresponds to an area of lower than average rainfall. Similarly the cluster in south-west India is also related to a high rainfall anomaly.
Finally, below is a
NASA image of population density for Asia. Dark red colours represent high population density, orange is low. It is clear that in Asia the population is very unevenly distributed. Note the high population densities in places that were particularly badly affected by landslides in July 2007. Thus, it is clear that the distribution of rainfall probably determines the distribution of landslides, and the density of population then determines the fatality total. Of course this is a bit of an over-simplification, not least because landslides only appear on the database if they kill someone, which means that the population density plays a role here too, but I am sure that you get the general idea.

Finally, it should be noted that Dalia Bach, Yang Hong and the TRMM team have also been looking at this issue and have completed an analysis for landslides in general. See this web page for details:
http://trmm.gsfc.nasa.gov/publications_dir/potential_landslide.html

 As a comparison, below are the statistics for July 2007 and July 2008, followed by the fatal landslides map for July 2008.
 The number of fatal landslides is about the same, but the number of fatalities is very different. At first glance these two maps are also quite similar, but if you look carefully there are some key differences:
 Now the TRMM rainfall anomaly data. The units are mm / day difference from the long term July mean.
 It should be fairly clear that there is a strong correlation between the distribution of fatal landslides and the rainfall anomaly in July 2007. In particular, the clusters along the southern edge of the Himalayan arc are focused almost exactly where the rainfall was unusually high. The apparent gap in central Nepal corresponds to an area of lower than average rainfall. Similarly the cluster in south-west India is also related to a high rainfall anomaly.
 Finally, it should be noted that Dalia Bach, Yang Hong and the TRMM team have also been looking at this issue and have completed an analysis for landslides in general. See this web page for details:
 Figure 1: TRMM image of the rainfall distribution for the seven days to 27th June 2008 at 06:00 UTC. Note the high rainfall totals for the Philippines and S. China, generated by the passage of Typhoon Fengshan (click on the image for a better view).

