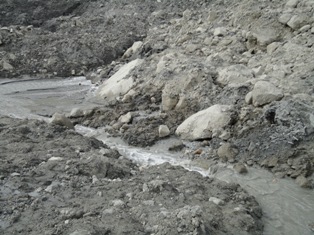
The end of the month marks the point at which I post the accumulated totals for fatal landslides, based upon the global fatal landslide database that I maintain. The raw figures for August are stark. The total number of fatal landslides recorded in the month was 71, resulting in 2,740 fatalities. This total is of course dominated by the Zhouqu landslide in China, which is reported to have resulted in 1,765 deaths. (Click on read more to access the remainder of this post).
These totals continue the exceptional trend of landslide occurrence in 2010. The average number of recorded fatality-inducing landslides in August in the period 2002-2009 is 46.7, resulting in an average of 348.3 deaths.
This graph illustrates the magnitude of the anomaly for 2010 to date. This shows the cumulative total number of recorded fatality-inducing landslides for 2003 (which had the lowest total of any year on the database), 2009 (the previous record year), 2010 to the end of August, and the average for 2003-2009. There is no doubt that 2010 is exceptional:
It is interesting that these totals have been recorded in a year that to date has had exceptionally low levels of tropical cyclone activity - indeed Northern Hemisphere tropical cyclone energy release remains at the lowest level for 30 years. When they occur, landfalling NW Pacific tropical cyclones (typhoons) have a major impact upon landslide occurrence. It is notable in particular that the Philippines and the Caribbean islands (especially Haiti) have been spared substantial tropical cyclone events to date this year. Given that there are strong signs that tropical cyclone activity is currently increasing in both the N. Atlantic and the Pacific, the next month will be very interesting.
Of course, the root cause of the exceptional occurrence of recorded landslides in August has been the intensity and volume of rainfall associated with the summer monsoon, primarily in China and Pakistan, and to a lesser extent Nepal. The monsoon should start to weaken during September, but more landslides are likely in the interim given the near-saturated state of the ground.
Showing posts with label Landslide data. Show all posts
Thursday, September 2, 2010
Thursday, June 17, 2010
Attabad - locals taking the situation into their own hands
Several media outlets in Pakistan are reporting that the level of frustration amongst the displaced people at Attabad has reached the point that they have taken the situation into their own hands. The Pamir Times has a pictorial record of what they have chosen to do - a large group have been working on the banks of the channel in an attempt to widen it. There is a full gallery of images here, from which these are taken:
Unfortunately, the amount that they can do in actually widening the channel is limited, whist the risks to those undertaking this work are high. Hacking away at the toe could destabilise the slope such that it collapses, dumping all of them in the water, and there is the potential for further slides from the slope behind.
Earlier reports suggested that people trying to join this effort from downstream has a confrontation with the police, and at least one person was injured.
I fear that this will ramp up the pressure on the authorities such that they will end up blasting the boulders without undertaking a full analysis. I hope that this does not happen - but that a proper study is undertaken urgently.
Thursday, March 11, 2010
The landslide at Attabad has developed seepage
Late last week the landslide at Attabad started to develop some seepage. Over the last few days this has gradually increased in rate and is now measured at about 9.4 cubic feet per second (0.25 cubic metres per second). The Pamir Times has some images of the seepage:
Given this volume of water it is likely that this is flow through the dam, although at the moment this remains unconfirmed. If so, this is a source of real concern as landslide dams sometimes fail through piping. Fortunately, both Focus and NDMA are monitoring this, but there is now a real urgency about getting an evacuation plan in place. This situation could now develop much more rapidly than we had anticipated a week ago.
Saturday, February 13, 2010
An analysis of fatal landslides in the Asia-Pacific region for 2006 to 2008
In my last post I published two maps of fatal landslide occurrence in the years 2006 to 2008 inclusive, based upon my long term fatal landslide database. In this post I focus on the Asia Pacific region. This analysis does not include seismically-induced landslides, most notably the Wenchuan (Sichuan) earthquake, which triggered a large number of slides, killing over 20,000 people.
The basic statistics of the data are in the table below - as per usual you can get a better version of the table and figures by clicking on the image:
In total, I recorded 796 fatal landslides (note that in this context I use landslides generically to include all non-avalanche mass movements, including rockfalls) in which 9941 people were killed. In terms of fatalities, the Philippines ranks highest (Fig. 1), although India is the country with the most fatal landslides (Fig. 2). Of course if the Wenchuan earthquake were included China would be the top of both lists
The seasonality of landslide occurrence varies greatly within this area. In South Asia there is a very strong influence from the S. Asian monsoon, which is very apparent in the monthly data (note that for these three graphs I have used the same y-axis scales so that they are directly comparable):
Fig. 3: Monthly recorded fatal landslide occurrence (line graph) and loss of life (bar graph) for South Asia
Fig. 4: Monthly recorded fatal landslide occurrence (line graph) and loss of life (bar graph) for East Asia
As with yesterday's post, I have no problem with this information being used elsewhere, but please reference the figures and information as follows:
Petley, D.N. 2010. An analysis of fatal landslides in the Asia-Pacific region for 2006 to 2008. Dave's Landslide Blog URL: http://daveslandslideblog.blogspot.com/2010/02/analysis-of-fatal-landslides-in-asia.html
The basic statistics of the data are in the table below - as per usual you can get a better version of the table and figures by clicking on the image:
In total, I recorded 796 fatal landslides (note that in this context I use landslides generically to include all non-avalanche mass movements, including rockfalls) in which 9941 people were killed. In terms of fatalities, the Philippines ranks highest (Fig. 1), although India is the country with the most fatal landslides (Fig. 2). Of course if the Wenchuan earthquake were included China would be the top of both listsThe seasonality of landslide occurrence varies greatly within this area. In South Asia there is a very strong influence from the S. Asian monsoon, which is very apparent in the monthly data (note that for these three graphs I have used the same y-axis scales so that they are directly comparable):
Fig. 3: Monthly recorded fatal landslide occurrence (line graph) and loss of life (bar graph) for South AsiaIn East Asia there is also a very strong seasonal signal, but note that here there is a more distinct peak in July and a decline thereafter (Fig. 4):
Fig. 4: Monthly recorded fatal landslide occurrence (line graph) and loss of life (bar graph) for East Asia In South-East Asia there is no strong seasonal signal - this is unsurprising in an area that is mostly tropical. Two distinct peaks do occur, one in February and one in November.
Fig. 5: Monthly recorded fatal landslide occurrence (line graph) and loss of life (bar graph) for South-East Asia
Fig. 5: Monthly recorded fatal landslide occurrence (line graph) and loss of life (bar graph) for South-East AsiaAs with yesterday's post, I have no problem with this information being used elsewhere, but please reference the figures and information as follows:
Petley, D.N. 2010. An analysis of fatal landslides in the Asia-Pacific region for 2006 to 2008. Dave's Landslide Blog URL: http://daveslandslideblog.blogspot.com/2010/02/analysis-of-fatal-landslides-in-asia.html
Tuesday, September 22, 2009
An interesting landslide website: Observatoire Multidisciplinaire des Instabilités de Versants' (OMIV)
In France there is an organisation called OMIV (Observatoire Multidisciplinaire des Instabilités de Versants), which is charged with the responsibility to "conduct geomorphologic, geologic, hydrologic, geophysical and seismic studies related to long-term monitoring, understanding of processes, and assessment of hazards at several active landslides". Perhaps most interestingly, they make the data from their various measurements available online, which provides a great research and teaching tool. The website is here:
http://eost.u-strasbg.fr/omiv/Accueil.html
The key aspect of the site is detailed four case studies of landslides in France. In each case detailed information is provided on each landslide, together with a quite detailed explanation of the slide. One example is the La Valette mudslide, which is this one (Google Earth image):

For each of the landslides it is possible to download an array of information, including maps, seismic datasets, movement data, meteorological data, groundwater data, etc. It is quite a resource, and its all available free of charge.
Friday, September 11, 2009
Real time landslide monitoring in New Zealand - the Utiku landslide
I have posted previously about the near real time landslide monitoring project that is being undertaken on the Taihape landslide by the GEONET team in New Zealand. The most amazing aspect of this project is that the monitoring data is streamed onto a web server and can then be viewed using a rather neat online graphing package (available here).
The great news is that the team have now instrumented another landslide on North Island, this time on a slightly more active slide at Utiku, which is not far from Taihape. Once again the data is being put online in near real time, and once again it can be viewed using the graphing package. This is available here.
This is how Geonet describes Utiku:
"The Utiku landslide has been classified as a deep-seated translational block-slide earth-flow. This classification refers to the characteristics of the landslide. Deep-seated refers to the depth of movement (depth to the landslide slip-plane); the slip plane of the Utiku landslide has been recorded at 20 m below ground level at the toe (bottom) and increasing to 65 m towards the back scarp (top). The term translational refers to the movement style of the landslide, where it moves as a relatively intact mass (raft) of material, along a planar zone of weakness. In this case, the zone of weakness corresponds to a thin clay layer thought to represent a bedding plane within the local sandstone . The term block-slide and earth-flow describe the landslide structure and movement mechanisms."
This is quite an old slide (at least 1,800 years, and possibly much older), but it remains active. The road that crosses the slide shows some minor signs of deformation that has required patching:
It will be very interesting to see how this landslide behaves as groundwater levels increase.
Sunday, September 6, 2009
August 2009 fatal landslide map
Here is the fatal landslide map for August 2009. As usual each yellow dot represents a single landslide that killed one or more people:
Click on the map for a better (downloadable) view in a new window.
The statistics are as follows:
Number of recorded fatal landslides: 53
Number of fatalities: 782
In terms of fatalities this places August well above the 2002-2008 average (347 fatalities). Of course this is dominated by Typhoon Morakot in Taiwan, and in particular the landslide at Hsiaolin. However, the map shows clearly the impact of the SW monsoon along the southern edge of the Himalayas and also the impact of typhoons in E. Asia. Elsewhere there is the normal smattering of landslides here and there. The lack of slides in S. America is perhaps surprising. The paucity of hurricanes in the Caribbean means that this area is not figuring at the moment. I wonder if we will see a large, late season event.
Click on the map for a better (downloadable) view in a new window.The statistics are as follows:
Number of recorded fatal landslides: 53
Number of fatalities: 782
In terms of fatalities this places August well above the 2002-2008 average (347 fatalities). Of course this is dominated by Typhoon Morakot in Taiwan, and in particular the landslide at Hsiaolin. However, the map shows clearly the impact of the SW monsoon along the southern edge of the Himalayas and also the impact of typhoons in E. Asia. Elsewhere there is the normal smattering of landslides here and there. The lack of slides in S. America is perhaps surprising. The paucity of hurricanes in the Caribbean means that this area is not figuring at the moment. I wonder if we will see a large, late season event.
Wednesday, July 15, 2009
June 2009 fatal landslide map
A little late, but here is the map of fatal landslides for June 2009. Regular readers will note a change in the quality of the map (for the better I hope). My achievement of the week is to teach myself GIS from scratch, so that now I can plot the data on decent quality maps. So here it is, plotted on the SRTM digital terrain model (Click on the map for a better view in a new window):
In total I recorded 22 landslides killing 155 people worldwide. Each dot above represents a single landslide. Sharp eyed readers will note that there is one missing from the above - there is a landslide in China that I have not yet located. The number killed is well below average (255 fatalities) for June, primarily because there are far fewer landslides in S. Asia than is normal for this time of year.
Sunday, June 21, 2009
Fatal landslides in 2009 so far - a review on the solstice
The summer solstice today seems like a good time to take stock of the position with fatal landslides to date, as collected in the Durham Fatal Landslide Database. Globally the fatal landslide season really starts in early June, the point at which the Asian monsoon starts to generate substantial amounts of rainfall in South and East Asia. Of course the greatest proportion of landslides occur in July and August, so we are before the main event.
So, how does the year look so far. Well, interesting actually. The graph below provides the cumulative number of recorded fatal landslides for 2007, 2008 and 2009, excluding the ones triggered by earthquakes (which obviously don't have a seasonal pattern). Obviously for 2007 and 2008 the full year graph is available.

You should be able to see that for 2007 and 2008 the normal S-shaped curve is clear, with a fairly low rate of increase in the first and last c.120 days. The time before this period, the northern hemisphere summer, shows a much greater rate of fatal landslides (i.e. a steeper line). It is also clear that in 2009 to date the number of fatal landslides is above the previous two years, although it is converging a little of late (of which more below). 2008 was anomalously low - 2007 is far more of an "average" year - although note that this is mostly because of the low number of recorded fatal landslides in the early part of the year.
The second graph, below, shows the recorded number of fatalities (again excluding those caused by earthquake-induced landslides). The coincidence between the patterns in 2007 and 2009 is very striking; again 2007 was very close to an average year on this measure. The comparatively low total at this point in 2008 is notable - but it is also clear that the rainy season resulted in a large number of fatalities (the large step is mostly due to hurricane-induced landslides in Haiti, plus a very active monsoon at this time).
One other aspects of this years data is really interesting. You may have noticed that in both the number of fatal landslides and the number of fatalities the trend in the last few weeks is a little anomalous. In particular, I would expect to see the steepening trend becoming clear as the Asian rainy season starts. However, this is clearly not the case as yet, as the graph below shows more clearly:
Here the blue line is the cumulative total of fatalities and the green line is the trend for fatal landslides. The recent flattening off is clear. This is mostly a clear indication of the rather strange pattern in the development of the South Asian monsoon this year. The northern passage of the monsoon appears to have stalled, as this map from the Indian Meteorological Agency shows:

Here the red lines are the average position of the monsoon front, whilst the green are the conditions observed this year. It appears that the northward advance is two weeks or so late at present - and it appears that this is being reflected in the fatal landslide data. However, the northward advance of the monsoon has apparently restarted this weekend, so the more usual trend may start to be displayed shortly.
Interestingly, there is some evidence that the SW Monsoon is weaker in El Nino years, and conditions are changing from La Nina to El Nino present. We are also recording more fatal landslides in South America than in recent years. However, it is far to early to tell whether the patterns that we are seeing this year are really associated with the possible El Nino conditions. It will be an interesting summer!
So, how does the year look so far. Well, interesting actually. The graph below provides the cumulative number of recorded fatal landslides for 2007, 2008 and 2009, excluding the ones triggered by earthquakes (which obviously don't have a seasonal pattern). Obviously for 2007 and 2008 the full year graph is available.

You should be able to see that for 2007 and 2008 the normal S-shaped curve is clear, with a fairly low rate of increase in the first and last c.120 days. The time before this period, the northern hemisphere summer, shows a much greater rate of fatal landslides (i.e. a steeper line). It is also clear that in 2009 to date the number of fatal landslides is above the previous two years, although it is converging a little of late (of which more below). 2008 was anomalously low - 2007 is far more of an "average" year - although note that this is mostly because of the low number of recorded fatal landslides in the early part of the year.
The second graph, below, shows the recorded number of fatalities (again excluding those caused by earthquake-induced landslides). The coincidence between the patterns in 2007 and 2009 is very striking; again 2007 was very close to an average year on this measure. The comparatively low total at this point in 2008 is notable - but it is also clear that the rainy season resulted in a large number of fatalities (the large step is mostly due to hurricane-induced landslides in Haiti, plus a very active monsoon at this time).
One other aspects of this years data is really interesting. You may have noticed that in both the number of fatal landslides and the number of fatalities the trend in the last few weeks is a little anomalous. In particular, I would expect to see the steepening trend becoming clear as the Asian rainy season starts. However, this is clearly not the case as yet, as the graph below shows more clearly:
Here the blue line is the cumulative total of fatalities and the green line is the trend for fatal landslides. The recent flattening off is clear. This is mostly a clear indication of the rather strange pattern in the development of the South Asian monsoon this year. The northern passage of the monsoon appears to have stalled, as this map from the Indian Meteorological Agency shows:
Here the red lines are the average position of the monsoon front, whilst the green are the conditions observed this year. It appears that the northward advance is two weeks or so late at present - and it appears that this is being reflected in the fatal landslide data. However, the northward advance of the monsoon has apparently restarted this weekend, so the more usual trend may start to be displayed shortly.
Interestingly, there is some evidence that the SW Monsoon is weaker in El Nino years, and conditions are changing from La Nina to El Nino present. We are also recording more fatal landslides in South America than in recent years. However, it is far to early to tell whether the patterns that we are seeing this year are really associated with the possible El Nino conditions. It will be an interesting summer!
Friday, November 14, 2008
October 2008 fatal landslide map
Rather later than is ideal (for which I apologise), here are the maps for fatal landslides in October 2008.
First, the statistics:
Number of recorded fatal landslides: 22
Number of recorded fatalities: 179
The average for the period 2002-2007 inclusive was 398 fatalities, excluding the impact of the Kashmir earthquake in 2005, so 2008 is considerably below the long term average.
This is the map of the fatal landslides that I recorded (click on the map for a better view):
As the SW monsoon ceases the concentration in S. Asia is now absent, so as usual the distribution has become far less concentrated.
This is the map of all of the fatal landslides that have I recorded in 2008 up to the end of October (again click on the map for a better view):
As usual, your comments and corrections are welcome.
First, the statistics:
Number of recorded fatal landslides: 22
Number of recorded fatalities: 179
The average for the period 2002-2007 inclusive was 398 fatalities, excluding the impact of the Kashmir earthquake in 2005, so 2008 is considerably below the long term average.
This is the map of the fatal landslides that I recorded (click on the map for a better view):
As the SW monsoon ceases the concentration in S. Asia is now absent, so as usual the distribution has become far less concentrated. This is the map of all of the fatal landslides that have I recorded in 2008 up to the end of October (again click on the map for a better view):
As usual, your comments and corrections are welcome.
Wednesday, October 1, 2008
September 2008 fatal landslide map
For the first time in recorded history the monthly fatal landslide map is actually on time!
Below is the map for September 2008. First the statistics:
Number of recorded fatal landslides: 59
Number of recorded fatalities: 1290
September has been a quite bizarre month, with fatal landslides occurring at a level that is much higher than expected. As such this continues the trend for August, which was also above average, but it bucks the trend for the rest of the year. At present I am not sure of the reason for this change - that will require some considerable analysis. It is very interesting indeed.
Comparison with previous years is difficult. In 2004 there were catastrophic landslides in Haiti that killed three thousand people. If this is included then the average across the period 2002-2007 is 808 - high, but still much less than in 2008. Excluding that single event in Haiti yields an average of 202 people. Note that 550 of the fatalities in 2008 were also in Haiti due to mudflows created by two tropical cyclones. Other large events were the Manshiyet Nasser landslide in Cairo, Egypt (107 fatalities) and the Shanxi flowslide (270 deaths).
So, here is the map for September 2008. As ever, you will need to click on the map to get a decent view of it:

A few things to note:
As usual I welcome any comments, corrections and clarifications.
Below is the map for September 2008. First the statistics:
Number of recorded fatal landslides: 59
Number of recorded fatalities: 1290
September has been a quite bizarre month, with fatal landslides occurring at a level that is much higher than expected. As such this continues the trend for August, which was also above average, but it bucks the trend for the rest of the year. At present I am not sure of the reason for this change - that will require some considerable analysis. It is very interesting indeed.
Comparison with previous years is difficult. In 2004 there were catastrophic landslides in Haiti that killed three thousand people. If this is included then the average across the period 2002-2007 is 808 - high, but still much less than in 2008. Excluding that single event in Haiti yields an average of 202 people. Note that 550 of the fatalities in 2008 were also in Haiti due to mudflows created by two tropical cyclones. Other large events were the Manshiyet Nasser landslide in Cairo, Egypt (107 fatalities) and the Shanxi flowslide (270 deaths).
So, here is the map for September 2008. As ever, you will need to click on the map to get a decent view of it:

A few things to note:
- The very strong cluster along the Himalayan Arc is once again very evident. Nepal in particular is suffering an intense period of landslides.
- There is also a clear cluster in the Caribbean as the Hurricane season continues to have a high impact. Note that in Haiti the cluster is a multiple event.
As usual I welcome any comments, corrections and clarifications.
Wednesday, September 17, 2008
August 2008 fatal landslide map
Better late than never (just a tad busy at the moment...), here is the fatal landslide map for August 2008. First the statistics:
Number of recorded fatal landslides: 61
Number of recorded fatalities: 537
As such August was substantially above the average for the last five years (212 fatalities). This is interesting as regular readers will know that until the end of July most months have been substantially below the five year average. July was particularly low. Therefore, this sudden increase in activity in August is slightly surprising and will be worthy of detailed analysis in due course.
So, first the map for August 2008. As ever, you will need to click on the map to get a decent view of it:
A few things to note:
I welcome any comments, corrections and clarifications.
Number of recorded fatal landslides: 61
Number of recorded fatalities: 537
As such August was substantially above the average for the last five years (212 fatalities). This is interesting as regular readers will know that until the end of July most months have been substantially below the five year average. July was particularly low. Therefore, this sudden increase in activity in August is slightly surprising and will be worthy of detailed analysis in due course.
So, first the map for August 2008. As ever, you will need to click on the map to get a decent view of it:
A few things to note:- The very strong cluster along the Himalayan Arc is now very evident. Nepal in particular is suffering an intense period of landslides.
- There is also a clear cluster in the Caribbean as the Hurricane season starts to take its toll.
- China is also experiencing a few events, but with no clear pattern.
I welcome any comments, corrections and clarifications.
Wednesday, August 27, 2008
The influence of the summer monsoon on fatal landslides in Asia
I am currently putting together a keynote paper for the forthcoming International Conference on Slopes, which is being held in Malaysia in November. I have been looking at the occurrence of fatal landslides in Asia, using the Durham Landslide Database as the source of data. I have plotted the number of fatal landslides by month for 2002-2007 for three areas - South Asia (i.e. the Indian subcontinent), East Asia (which includes China, Taiwan, Korea and Japan) and SE. Asia (which should be self evident). The graphs are shown below (note the different magnitudes of the y-axis scales by the way).
First, South Asia shows a very strong monsoon signal. Look in particular at the mean trend for the five years. The level of fatal landsliding in the winter months is very low, with most of the events occurring in June to September. It is also clear that the number of landslides increases rapidly at the start of the monsoon as the rain bands push northwards, but then decline slowly as the monsoon disperses. There is also considerable year-on-year variation; in particular the very strong and prolonged monsoon rainfall across parts of India is very clear for 2007.
East Asia (below) also shows a strong monsoon signal, of course slightly modified by the impact of typhoons too. Here though the pattern is quite different - again look at the graph of the mean of the other data. In this case the monsoon signal is far more symmetrical, again reaching a peak in July but rising and declining at about the same rate. Again there is considerable year-one-year variation both in terms of number of events and the variation through the year. The big spike in July 2006 is particularly clear.
SE. Asia present a completely different picture (below). As much of SE. Asia is tropical there is far less monthly variation. Unsurprisingly no monsoon spike is seen. The occurrence of landslides is slightly higher in the latter part of the year as the rainy season affects Indonesia for example. Of particular note are the variations in the distribution between years - this really does reflect the occurrence of extreme tropical cloud bursts.

So the impact of the really large scale climate systems on Asian landslides is absolutely clear. This is particularly interesting in the context of climate change - exactly how the Asian monsoon in particular will change will partially determine the landslide impact. Unfortunately the models are not resolving this issue too well at the moment, but most do suggest an increase in the occurrence of the most intense rainfall events. The implications for landslides of this are stark.
First, South Asia shows a very strong monsoon signal. Look in particular at the mean trend for the five years. The level of fatal landsliding in the winter months is very low, with most of the events occurring in June to September. It is also clear that the number of landslides increases rapidly at the start of the monsoon as the rain bands push northwards, but then decline slowly as the monsoon disperses. There is also considerable year-on-year variation; in particular the very strong and prolonged monsoon rainfall across parts of India is very clear for 2007.
East Asia (below) also shows a strong monsoon signal, of course slightly modified by the impact of typhoons too. Here though the pattern is quite different - again look at the graph of the mean of the other data. In this case the monsoon signal is far more symmetrical, again reaching a peak in July but rising and declining at about the same rate. Again there is considerable year-one-year variation both in terms of number of events and the variation through the year. The big spike in July 2006 is particularly clear.
SE. Asia present a completely different picture (below). As much of SE. Asia is tropical there is far less monthly variation. Unsurprisingly no monsoon spike is seen. The occurrence of landslides is slightly higher in the latter part of the year as the rainy season affects Indonesia for example. Of particular note are the variations in the distribution between years - this really does reflect the occurrence of extreme tropical cloud bursts.
So the impact of the really large scale climate systems on Asian landslides is absolutely clear. This is particularly interesting in the context of climate change - exactly how the Asian monsoon in particular will change will partially determine the landslide impact. Unfortunately the models are not resolving this issue too well at the moment, but most do suggest an increase in the occurrence of the most intense rainfall events. The implications for landslides of this are stark.
Tuesday, August 12, 2008
July 2008 fatal landslide map
The map below shows the provisional distribution of fatal landslides for June 2008. The (again provisional) statistics are:
Number of fatal landslides: 55
Number of fatalities: 2127
Once again, the number of recorded fatalities this month has been substantially below the average for 2002-2007, which is 504 deaths. This is consistent with the monthly totals for the whole of the year - indeed at the moment 2008 has the lowest number of fatalities that I have recorded for any year, excluding the Wenchuan (Sichuan) earthquake of course. I will in due course write a post about the likely causes of this very interesting pattern.
Figure 1 shows the distribution map for July. As ever, click on the map for a bigger version. Please acknowledge any use of it or Fig. 2.

The effect of the monsoon in South Asia is now being clearly felt, with a very marked line of landslides along the southern edge of the Himalayas. The usual cluster of landslides in Central China is also clear. Once again there is a higher incidence of landslides in Central and S. America than is normal.
Fig. 2 shows all of the recorded fatal landslides in 2008 to the end of July, excluding those associated with the Wenchuan (Sichuan) earthquake. The typical annual patterns are now becoming clear, with clusters in Central China, S. Asia along the southern edge of the Himalayas, the Philippines and Central / S. America. There are certainly more recorded fatal landslides in the latter area so far this year than has been the pattern over the last few years, but there are also rather fewer in the Himalayas. The western part of the Himalayan chain (e.g. Kashmir) in particular seems to have far fewer fatalities than has been the case for the last few years.
Fig. 2: Recorded fatal landslides in 2008 up to the end of July. Each dot represents a single landslide. Click on the map for a larger version in a new window.
Please leave a comment about this map and dataset! I would really like to know what you think about the data, the maps and the general approach.
Of course, if you know of an event that I might have missed I would like to hear from you...
Number of fatal landslides: 55
Number of fatalities: 2127
Once again, the number of recorded fatalities this month has been substantially below the average for 2002-2007, which is 504 deaths. This is consistent with the monthly totals for the whole of the year - indeed at the moment 2008 has the lowest number of fatalities that I have recorded for any year, excluding the Wenchuan (Sichuan) earthquake of course. I will in due course write a post about the likely causes of this very interesting pattern.
Figure 1 shows the distribution map for July. As ever, click on the map for a bigger version. Please acknowledge any use of it or Fig. 2.

Fig. 1: July 2008 fatal landslide locations (click on the map for a larger version)
The effect of the monsoon in South Asia is now being clearly felt, with a very marked line of landslides along the southern edge of the Himalayas. The usual cluster of landslides in Central China is also clear. Once again there is a higher incidence of landslides in Central and S. America than is normal.
Fig. 2 shows all of the recorded fatal landslides in 2008 to the end of July, excluding those associated with the Wenchuan (Sichuan) earthquake. The typical annual patterns are now becoming clear, with clusters in Central China, S. Asia along the southern edge of the Himalayas, the Philippines and Central / S. America. There are certainly more recorded fatal landslides in the latter area so far this year than has been the pattern over the last few years, but there are also rather fewer in the Himalayas. The western part of the Himalayan chain (e.g. Kashmir) in particular seems to have far fewer fatalities than has been the case for the last few years.
Fig. 2: Recorded fatal landslides in 2008 up to the end of July. Each dot represents a single landslide. Click on the map for a larger version in a new window.Please leave a comment about this map and dataset! I would really like to know what you think about the data, the maps and the general approach.
Of course, if you know of an event that I might have missed I would like to hear from you...
Wednesday, June 11, 2008
Deaths and research in landslides
Now that the Tangjiashan crisis is over, it is clearly time to move on to other things. I will post
a retrospective on that event when the dust has settled. For now I think we should allow the Chinese to bask in the success of their achievement.
To change the topic, I thought it would be interesting to post an analysis that I did a couple of years ago. The analysis was simple but quite fun - I looked at the landslide fatality database for 2003 and 2004 by calculating the proportion of fatalities by large geographical area. I then looked at the field areas of the research presented in the Springer journal Landslides and in papers presented at a selection of international landslide conferences, and worked out the proportions as per the fatalities.
Now ideally there should be some relationship between the locations of landslide deaths and the locations of landslide research, one would hope. Care is needed as:
1. One year of landslide data might not be representative; and
2. The sample of the areas of research might not be representative.
However, the plot does show how far we are from an equitable situation:

In my simplistic world I would hope that most areas plot close to the central line on the graph. In most cases this is clearly not so. The regions with really serious landslide problems in this period - Central America, SE. Asia and S. Asia has a tiny proportion of the research. Regions that dominated the research into landslides - North America and Europe - had very few landslide fatalities. Only East Asia looks to be in the right place amongst those regions with large numbers of both research projects and fatalities.
Two things emerge:
1. Care is needed because in 2004 landslides in Haiti caused huge problems, which mean that for this period Central America dominates the statistics. If we were to take the period 2002-2006 East and South Asia would dominate the fatality count.
2. Only E. Asia appears to have the balance right between research and fatalities. This reflects the large landslide programmes in China, Japan, Hong Kong and Taiwan.
Of course the picture might look different if this were to be examined through the lens of economic losses rather than fatalities, but not I suspect if we were to normalise by GDP or per capita income. All of which serves to highlight the fact that the landslide research community should shift its focus if it really wants to make a difference by saving lives.
I will try to do a better analysis of the full dataset over the summer, but thought it would be interesting to share this initial analysis.
Saturday, May 10, 2008
Landslide sizes (numbers killed) around the world
One of the interesting aspects of our landslide fatality database is that it is possible to produce maps of the size of the impact of landslides (which in this case means the numbers of people killed) in each event around the world. I tried to do that for my EGU presentation, but my colleague Nick Rosser has produced a rather more attractive version (Fig. 1) showing the 2007 dataset.
Fig 1: Map of the size of the impact of landslides, as measured by the number of fatalities in each event, for 2007. Click on the map to open a larger version.
The variation in size is quite interesting. Note that in Europe, N. America and Japan the recorded landslides tend to be comparatively small, almost always resulting in less than five fatalities. South Asia and Central America on the other hand have a scatter of landslide sizes from small events through to the very large. China also has a high frequency of large landslides, but appears to have comparatively few small ones. Africa has surprisingly few recorded fatal landslides, but those that do occur tend to be quite large.
So what to make of this? Well, first and foremost it shows the different levels of mitigation of landslides around the world. In the more developed world (i.e. Europe and N. America), large landslides tend to be very well mitigated (i.e. engineering measures have been used to stabilise them). The few fatal landslides that do occur tend to be small and in fairly remote locations, resulting in low fatality counts. On the other hand, in South and South-East Asia, mitigation is much less likely and there is a high density of people in affected areas, meaning that fatality counts are much higher. There might also be an effect of the both the tectonic setting (i.e. the high mountains of S. Asia in particular might mean that the fatal landslides are larger) and the climate (i.e. torrential monsoon rainfall might tend to trigger very energetic landslides, which are more likely to kill, perhaps). Finally, the data also perhaps show that the current database still misses smaller landslide events in China and in particular in Africa. We are trying to improve this situation.
As ever your comments are really welcome.
Fig 1: Map of the size of the impact of landslides, as measured by the number of fatalities in each event, for 2007. Click on the map to open a larger version. The variation in size is quite interesting. Note that in Europe, N. America and Japan the recorded landslides tend to be comparatively small, almost always resulting in less than five fatalities. South Asia and Central America on the other hand have a scatter of landslide sizes from small events through to the very large. China also has a high frequency of large landslides, but appears to have comparatively few small ones. Africa has surprisingly few recorded fatal landslides, but those that do occur tend to be quite large.
So what to make of this? Well, first and foremost it shows the different levels of mitigation of landslides around the world. In the more developed world (i.e. Europe and N. America), large landslides tend to be very well mitigated (i.e. engineering measures have been used to stabilise them). The few fatal landslides that do occur tend to be small and in fairly remote locations, resulting in low fatality counts. On the other hand, in South and South-East Asia, mitigation is much less likely and there is a high density of people in affected areas, meaning that fatality counts are much higher. There might also be an effect of the both the tectonic setting (i.e. the high mountains of S. Asia in particular might mean that the fatal landslides are larger) and the climate (i.e. torrential monsoon rainfall might tend to trigger very energetic landslides, which are more likely to kill, perhaps). Finally, the data also perhaps show that the current database still misses smaller landslide events in China and in particular in Africa. We are trying to improve this situation.
As ever your comments are really welcome.
Sunday, May 4, 2008
The Taihape Landslide monitoring project
Last summer I was lucky enough to spend a couple of days with my friends from GNS Science who are undertaking a monitoring project on the Taihape landslide in New Zealand (see Google Earth image right). Taihape, which is located as -39.68°, 175.80°, is described on Wikipedia as "a small, picturesque town near the middle of the North Island . It services a large rural community and lies on the main north-south route through the centre of the North Island." It has a population of about 2000 people and is in general a very nice little place. Unfortunately, the area around the town is somewhat landslide prone (actually, mapping landslides here would probably involve trying to find those few areas that have not been affected by mass movements!).The strength of this project is in its thoroughness and its transparency. The monitoring system being used is about as good as is possible using current technology, and the team are taking great care to quantify and deal with the potential errors. The fact that the results are online is hugely impressive. I can only wish that more landslide movement data was available in this way.
Friday, May 2, 2008
April 2008 landslide map
The map below shows the distribution of fatal landslides for April 2008.
The statistics are:
Number of fatal landslides: 12
Number of fatalities: 33
As I predicted in March, April was once again very substantially below the average for 2003-2007, which is 96 fatalities per year. The distribution is very random, with absolutely no clear pattern. Two fatal landslides occurred in the Himalayan Arc, which is a sign of things to come over the next few months. La Nina conditions do still prevail, but the event continues to weaken. Typically the number of landslides starts to increase around early May. This is shown by the cumulative totals - for example, at the end of April 2004 I had recorded just 339 fatalities for the year to date (this years total is even lower - 301), but by the end of May 2004 this had jumped to 1136. It could be an interesting month!
Some patterns are starting to emerge in the annual map. Note in particular the emerging clusters in the Himalayas, western Central America, the Philippines and Indonesia. These are the normal locations for fatal landslide clusters. The cluster in the Himalayas is focused on the west side at the moment as this area gets heavy rain in the early part of the year. It will spread eastwards over the next three months.

2008 fatal landslide locations up to the end of April (click for a larger version)
Wednesday, April 2, 2008
March 2008 landslide map
The map below shows the distribution of fatal landslides for March 2008.
The statistics are:
Number of fatal landslides: 17
Number of fatalities: 77
Thus February was well below the average for 2003-2007, which is 129 fatalities per annum. The distribution is definitely atypical, with more than usual for this time of year in S. America but less in Asia. This would seem to reflect the current La Nina conditions, which have also led to a globally cool spell (as an aside this has got the global warming denier community amusingly over-excited). La Nina conditions do still prevail, but the event is now weakening. Thus, we might sell see below average numbers of landslides for April (but above April for S. America again perhaps).
Friday, February 8, 2008
Landslides and buses
A nasty landslide this week in Peru triggered some thoughts about the occurrence of landslides that kill the passngers on buses. The event that triggered these thoughts occurred on 6th February when heavy rain dislodged a boulder hit a bus and knocked it into the Tarma River in Junin Province in Peru. Seven people were killed and a further 23 were injured.
TV3 news in New Zealand had this picture of the remains of the vehicle:
Such events appear on the database quite often, so I thought it might be interesting just to look at the 2007 data to see where and when they occur. These are the bus-related landslides within the Durham database:
It is clear that there is a particular problem with landslides affecting buses in mountain areas, particularly in Asia. Over 200 deaths is a very high impact indeed. The impacts occur in one of three main ways:
1. Buses being hit by landslides or by rockfalls and knocked into a river (as in the case of Peru this week)
2. Buses being buried by landslide debris (this happened in the Pakistan example)
3. Buses being affected by a human induced failure. The Badong event in China was the result of a rockfall triggered by tunnel construction.
There are occasional other factors too - in one case the accident occurred because the driver was speeding to attempt to avoid a rockfall. I suspect that no-one has ever undertaken a systematic study of bus-related landslide fatalities. This is probably an important topic.
TV3 news in New Zealand had this picture of the remains of the vehicle:
| Date | Country | Location | Fatalities | Injuries |
| 24/02/2007 | | Sanadhi (Paniola) village, 15 kilometres away of Rawalakot, | 15 | 5 |
| 12/03/2007 | | Nauliband area of the Rudraprayag district, Uttarakhand | 18 | 32 |
| 02/04/2007 | | Pengshui, | 7 | 1 |
| 25/05/2007 | | Shimian to Hanyuan county in the central western city of | 10 | 14 |
| 04/07/2007 | | | 32 | |
| 20/08/2007 | | Palpa-Tamghas road, Palpa | 25 | |
| 02/09/2007 | | Ghansali town in Tehri district, Uttarakhand | 19 | 20 |
| 17/09/2007 | | Rudraprayag district, Uttarakhand | 19 | 28 |
| 11/10/2007 | | Vishnuprayag, Chamoli district of Uttarakhand | 41 | |
| 20/11/2007 | | Badong county, Enshi Tujia and | 35 | 1 |
| | | Totals | 221 | 101 |
It is clear that there is a particular problem with landslides affecting buses in mountain areas, particularly in Asia. Over 200 deaths is a very high impact indeed. The impacts occur in one of three main ways:
1. Buses being hit by landslides or by rockfalls and knocked into a river (as in the case of Peru this week)
2. Buses being buried by landslide debris (this happened in the Pakistan example)
3. Buses being affected by a human induced failure. The Badong event in China was the result of a rockfall triggered by tunnel construction.
There are occasional other factors too - in one case the accident occurred because the driver was speeding to attempt to avoid a rockfall. I suspect that no-one has ever undertaken a systematic study of bus-related landslide fatalities. This is probably an important topic.
Subscribe to:
Posts (Atom)